The U.S. economy continues to exude resilience as we make our way through the early months of the New Year. And capital markets are increasingly reflecting this strength including the headline benchmark S&P 500 Index, which has cleared the 5000 level and is already surging toward 5100. Amid this atmosphere where everything is seemingly awesome, it is worthwhile to skim the foam from the top of the stock market beer and consider the downside risks. More specifically, it’s worthwhile to examine some key indicators for any signs of stress that are building underneath the market surface that could eventually bring the party to an end.
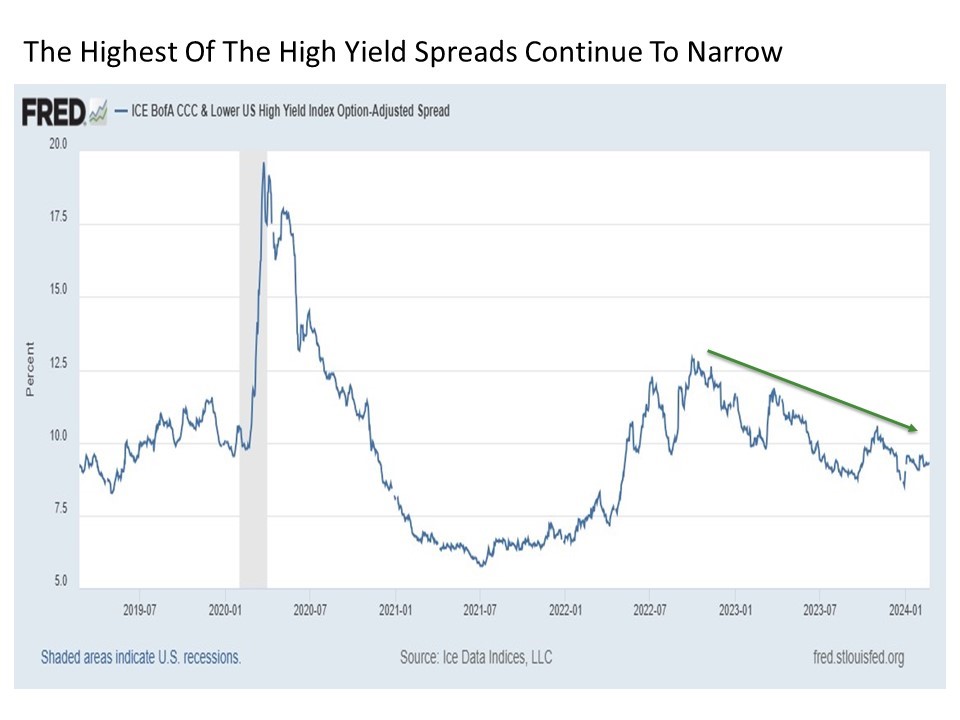
Spreads. Our first stress test indicator that we’ll consider is bond spreads. This is the additional interest rate premium beyond comparably dated U.S. Treasuries that investors need to receive to justify taking on the risk of owning securities like corporate bonds and mortgage-backed securities. And to determine whether market stress is starting to build underneath the market surface, often the best place to look is not only the high yield bond market but the highest yielding of the high yield bond market. This is the CCC-rated and lower corporate bond space. Put simply, if investors are becoming more risk adverse and are starting to worry about not getting their money back on their loans, the CCC and lower space is historically where this stress starts to show up first.

So where do we stand with CCC and lower spreads today? A few years ago, the stress was real, as CCC and lower spreads started widening in July 2021, which was nearly half a year before the stock market finally peaked in early 2022. But since late 2022, CCC and lower spreads have been steadily narrowing. This suggests that investors are becoming increasingly risk tolerant as the rebound from the October 2022 lows continues. And given how tight these spreads were just a few years ago, the potential for further spread tightening remains as we continue through 2024.
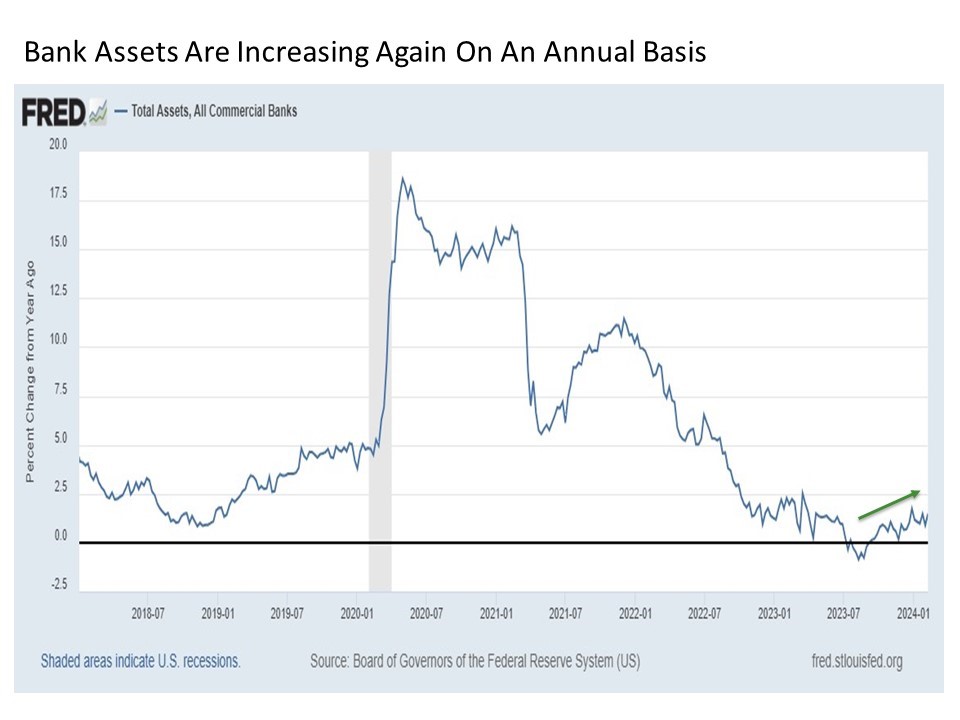
Assets. Another stress indicator for consideration is commercial bank assets. These assets include the various loans made by banks and the securities such as U.S. Treasuries owned by the bank. Basically, if the growth in bank assets is decelerating, it implies that the volume of loans being provided by commercial banks is increasing at a slowing rate if not outright declining, thus the flow of liquidity in the financial system is slowing. Conversely, if bank asset growth is accelerating, it suggests that banks are becoming more inclined to lend, thus increasing the flow of liquidity in the financial system.

Where do we stand today with total bank asset growth? Over the last few years since the onset of COVID, the growth of bank assets had been steadily decelerating on an annual basis. This included 2022 and into 2023, when the growth of total bank assets eventually turned negative by the middle of last year. But since that time, bank asset growth has steadily and gradually increased. This provides added confirmation to recent data also suggesting that a shrinking percentage of banks are tightening lending standards, which suggests the flow of liquidity through the banking system is gradually becoming more supportive.
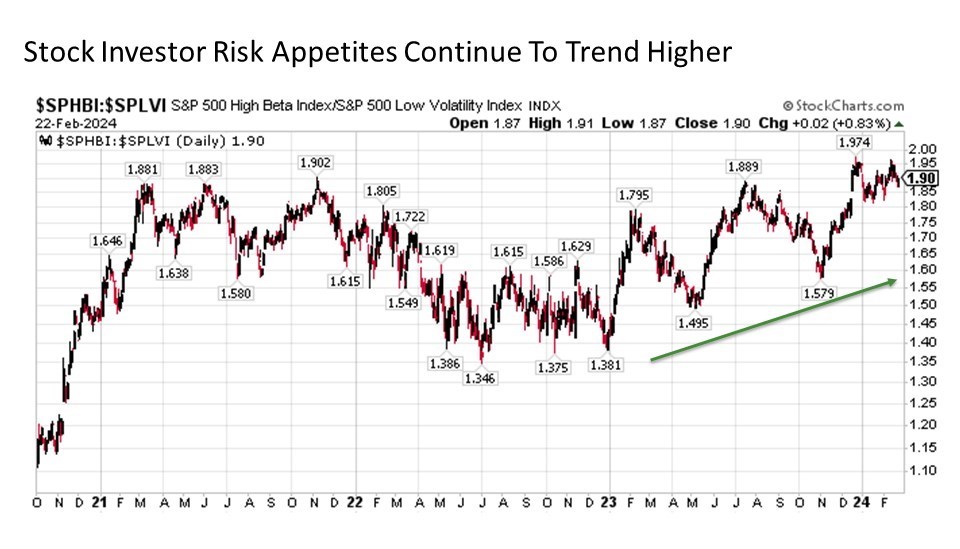
Speculation. Two other stress indicators we will consider are more directly market related. The first is the performance ratio of high beta stocks within the S&P 500 versus their low volatility peers. High beta stocks tend to outperform when investor risk appetites are increasing, while low volatility stocks typically outperform when investors are becoming more risk averse.

Since the start of 2023, we have seen investors become increasingly more speculative by this measure. As shown in the chart above, high beta stocks are outperforming low volatility stocks when the line is rising, which has been the case with fits and starts dating back to the beginning of last year. This, of course, strikes a stark contrast to 2022 when the line was falling as low volatility outperformed high beta. While this measure provides further support to the idea that a short-term stock market correction may be overdue, speculative fervor remains alive and well in today’s market.
The second stress indicator we will consider is the price performance of the NASDAQ 100 relative to Bitcoin. The tech heavy NASDAQ 100 has been the destination of choice for investors willing to own the stocks of companies at any price, valuation metrics be damned. And cryptocurrencies including Bitcoin have been the quintessential speculators instrument for many years now, as they remain assets that are largely without underlying intrinsic value.

Dating back to the middle of last decade, the performance of the NASDAQ 100 and Bitcoin has been highly correlated. During times when one got ahead or behind the other, they eventually reconverged. Today, they are both surging strongly to the upside, suggesting a particular lack of stress as speculative behavior is alive and well.
Bottom line. Often during stock market history, we have had phases where stocks are performing well at a time when underlying stresses are accumulating under the surface. And in many instances, these foreshadowing stresses eventually bubble up to derail the major stock market indices. The good news is that many of these key stress indicators, including those highlighted above are signaling that risk tolerance is if anything continuing to build in the marketplace today. This bodes well for capital market assets as we continue to make our way through 2024.
Disclosure: I/we have no stock, option or similar derivative position in any of the companies mentioned, and no plans to initiate any such positions within the next 72 hours. I wrote this article myself, and it expresses my own opinions. I am not receiving compensation for it. I have no business relationship with any company whose stock is mentioned in this article. Investment advice offered through Great Valley Advisor Group (GVA), a Registered Investment Advisor. I am solely an investment advisor representative of Great Valley Advisor Group, and not affiliated with LPL Financial. Any opinions or views expressed by me are not those of LPL Financial. This is not intended to be used as tax or legal advice. All performance referenced is historical and is no guarantee of future results. All indices are unmanaged and may not be invested into directly. Please consult a tax or legal professional for specific information and advice.
Compliance Tracking #: 545203-1
