The U.S. stock market much like most of the country this summer remains blazing hot. The S&P 500 has already notched a +18% year to date return, and every single trading day so far in July has brought with it a new all-time high for the benchmark index. How much longer should we expect these blistering stock returns to continue through the rest of the summer?
Overheating. The returns on the S&P 500 are undoubtedly fantastic. And the uptrend in the market dating back to the October 2022 lows remains very much intact. If anything, the performance of the headline index has almost become too good as of late.

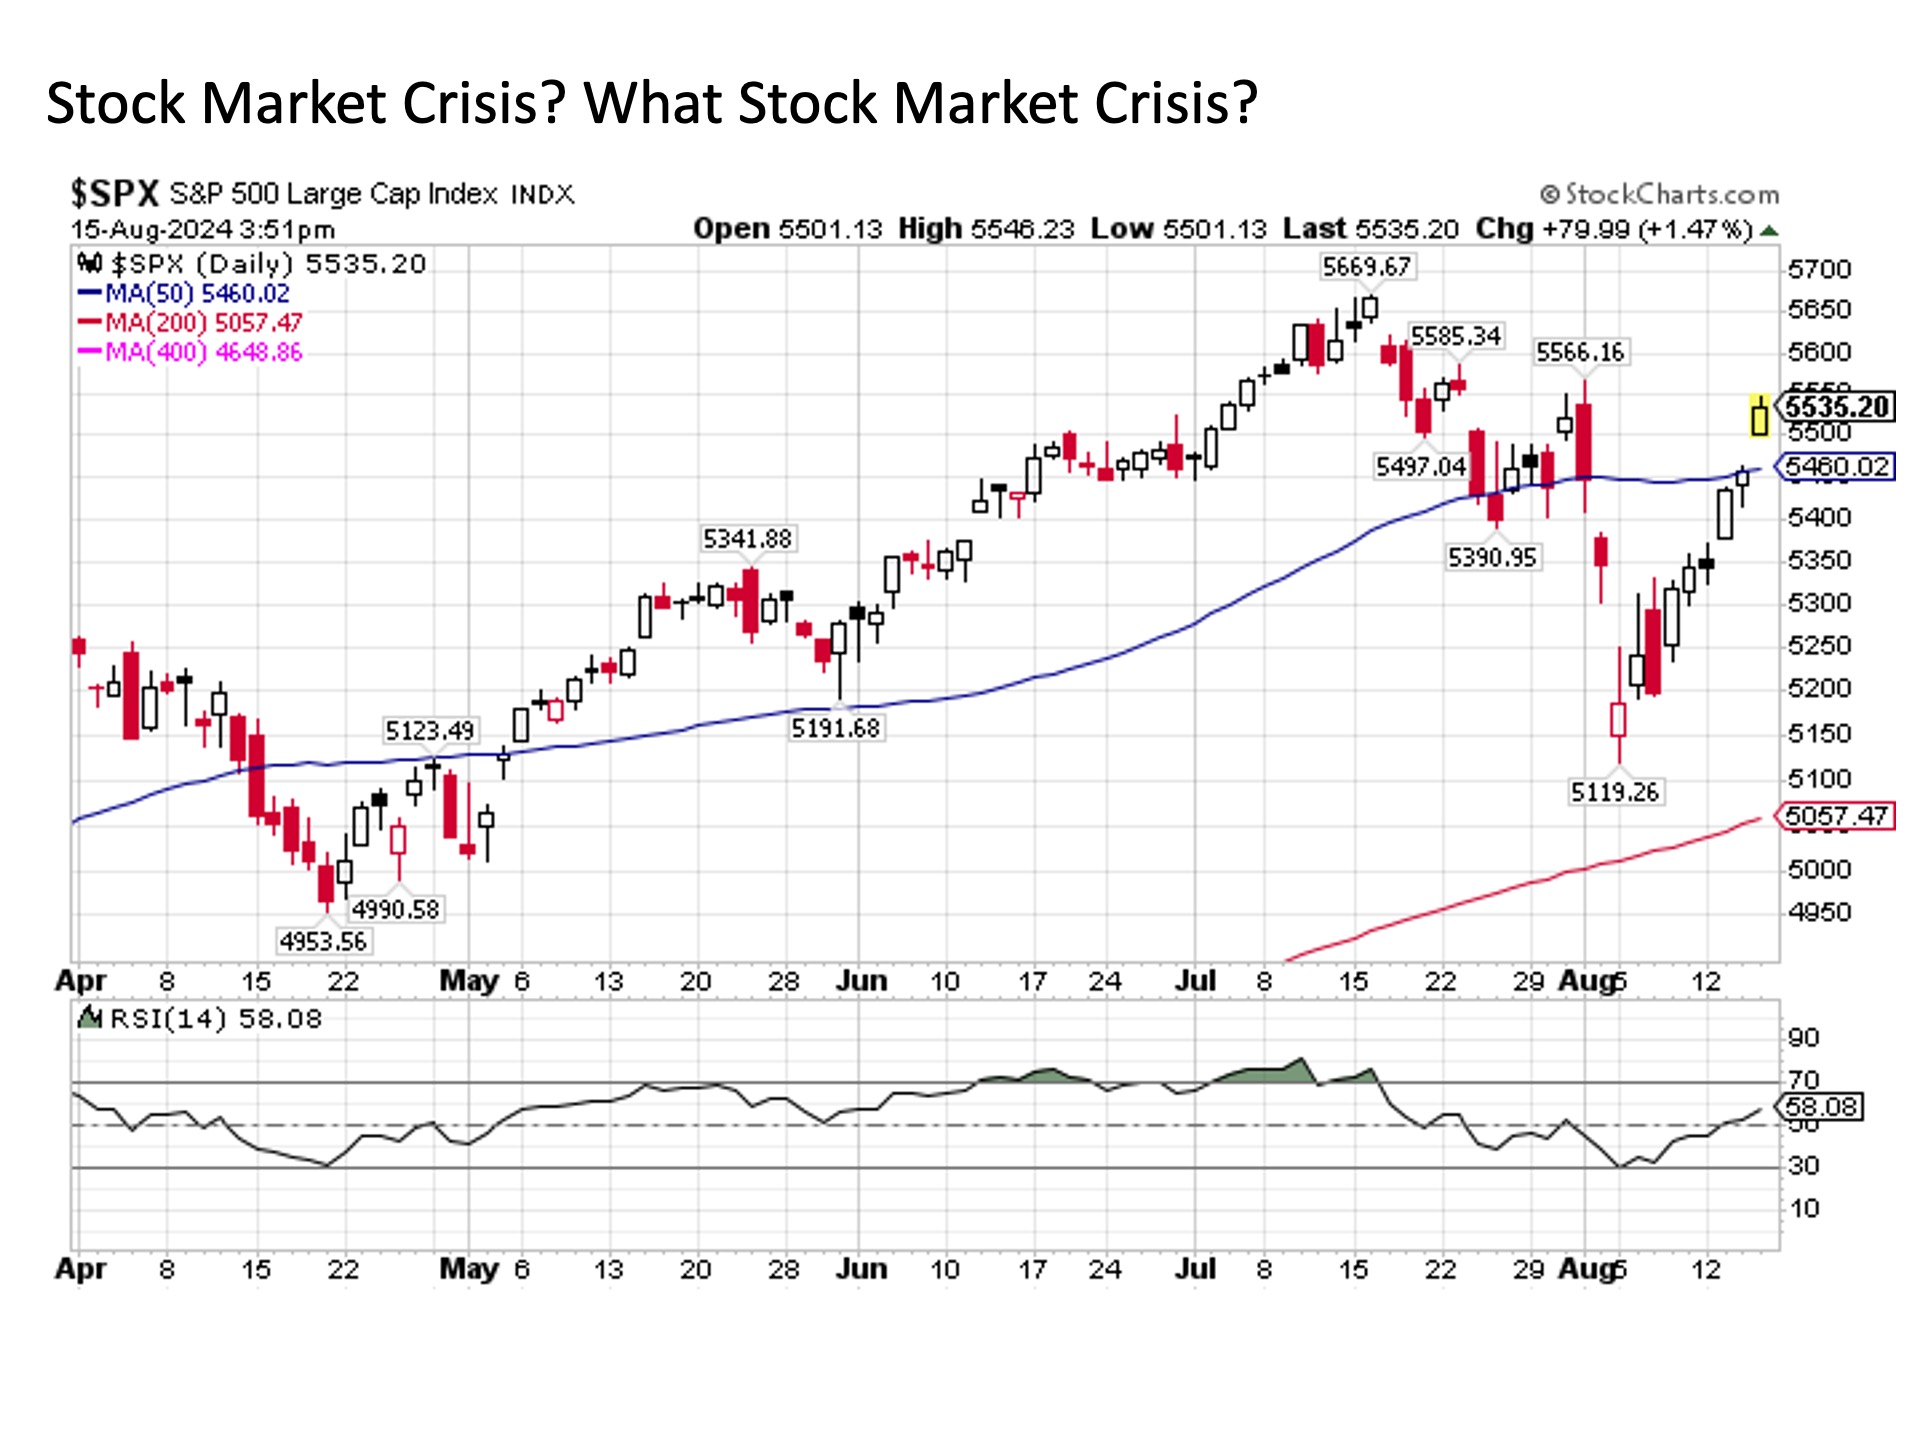
Here is the issue. The S&P 500 index is running well ahead of trend on a variety of metrics, some of which are shown in the chart above.
First, the S&P 500 trading at over 5600 today is running well ahead of its long-term trendline dating back to the October 2022 lows. As we have seen numerous times over the past nearly two years, the S&P has repeatedly mean reverted back to this long-term trendline. And given that the market’s current gap above this trendline is historically wide similar to late July 2023 and March 2024 levels, it stands to reason how much further the current rally can stretch before gravity starts to pull it back to earth.
Next, the same can be said of the S&P 500 relative to its moving average trend lines. This includes its medium-term 50-day (blue line on chart above), long-term 200-day (red line), and ultra long-term 400-day (pink line) moving averages on the chart above. Not only is the S&P 500 today trading well above all of these trendlines that represent where we could reasonably expect the market to be trading over these respective time periods, but the gap between these 50-day, 200-day, and 400-day moving averages are also wide in their own right. This means that not only is the market running hot, but it has been running hot for a while now. Historically, this set up has eventually given way to at least some degree of consolidation.
Lastly, the S&P 500 is currently trading with a Relative Strength Index (RSI) reading well north of 70 at nearly 76. Historically, an RSI reading over 70 has signaled overbought conditions with the market overdue for some sort of pullback. The fact that we are measurably above the 70 line only highlights further to the degree today’s market is overextended.
Getting thirsty. The market may be overbought, but that doesn’t necessarily mean it’s going to break to the downside. One has to look no further than last December or this March when the market was similarly overbought and either continued unabated to the upside or entered into only a mild pullback before continuing its march higher. As a result, it raises the question as to what catalysts might exist, if any, that would induce the market to pull back in a more sustainable way.
One key factor deals with liquidity. The available money sloshing around capital markets has been abundant for years save the inflationary stretch earlier this decade. And as long as liquidity conditions remain abundant, stocks can continue to rise regardless of the price. If liquidity conditions start to dry up, however, this can be a catalyst to cause stock prices to fall regardless of how sound the underlying fundamentals may be.
A good measure of market liquidity is the price of Bitcoin. Why? Because it is the quintessential speculator’s instrument, as it has no intrinsic value and has historically moved with the speculative liquidity fueled waves of the markets over the years. Further to this point, the price of Bitcoin has been highly correlated with the NASDAQ 100, where the more speculative fare on offer in equity markets can be found.

Thus, the recent price movements between Bitcoin and the NASDAQ 100 are notable. For while the NASDAQ 100 continues striding to new all-time highs, we see that Bitcoin peaked in February and has been trading sideways in the months since. And while it was running ahead of trend for a few months, the price of Bitcoin has been lurching sharply lower since the beginning of June. Whether this is an indication of marginally tightening market liquidity conditions remains to be seen, but it will be worth monitoring whether Bitcoin prices catch up with the NASDAQ 100 or if the overheated tech index (and the broader S&P 500 that is so heavily weighted to tech today) catches down with the price of Bitcoin.
Bottom line. The U.S. stock market continues to blaze as we make our way through the summer months. And while these fires may continue to burn bright, we should be prepared for a market that is overheating on many measures may need to take a breather in the form of a -5% to -10% short-term correction as we make our way through the rest of the summer. If any such near-term correction were to occur, it’s likely to be short lived (two to six weeks), as underlying economic and corporate earnings fundamentals remain sufficiently strong to support a further rising stock market.
I/we have no stock, option or similar derivative position in any of the companies mentioned, and no plans to initiate any such positions within the next 72 hours. I wrote this article myself, and it expresses my own opinions. I am not receiving compensation for it. I have no business relationship with any company whose stock is mentioned in this article.
Investment advice offered through Great Valley Advisor Group (GVA), a Registered Investment Advisor. I am solely an investment advisor representative of Great Valley Advisor Group, and not affiliated with LPL Financial. Any opinions or views expressed by me are not those of LPL Financial. This is not intended to be used as tax or legal advice. All performance referenced is historical and is no guarantee of future results. All indices are unmanaged and may not be invested into directly. Please consult a tax or legal professional for specific information and advice.
Compliance Tracking #: 602383-1
