Just over a week ago, both stock and bond markets were long overdue for a bounce. And bounce they have. Just like a slingshot, the further and deeper capital markets pulled back through late October, the greater the energy released once the upside rally finally arrived. In the wake of this recent capital market burst, it is worthwhile to evaluate both where we stand today and what we can reasonably expect in the weeks ahead through the end of the year.
Abrivado. The upside momentum came in a hurry for the U.S. stock market last week. After failing at medium-term 50-day moving average resistance (blue line in chart below) back on October 17, the forward path for the S&P 500 appeared increasingly bleak. Stocks quickly retreated and subsequently sliced through key support at its long-term 200-day moving average support (red line in chart below). By October 27, the S&P 500 had fallen all the way back to its ultra long-term 400-day moving average (pink line in chart below), a key support level that historically is rarely crossed and often signals major directional changes in the market once breached.
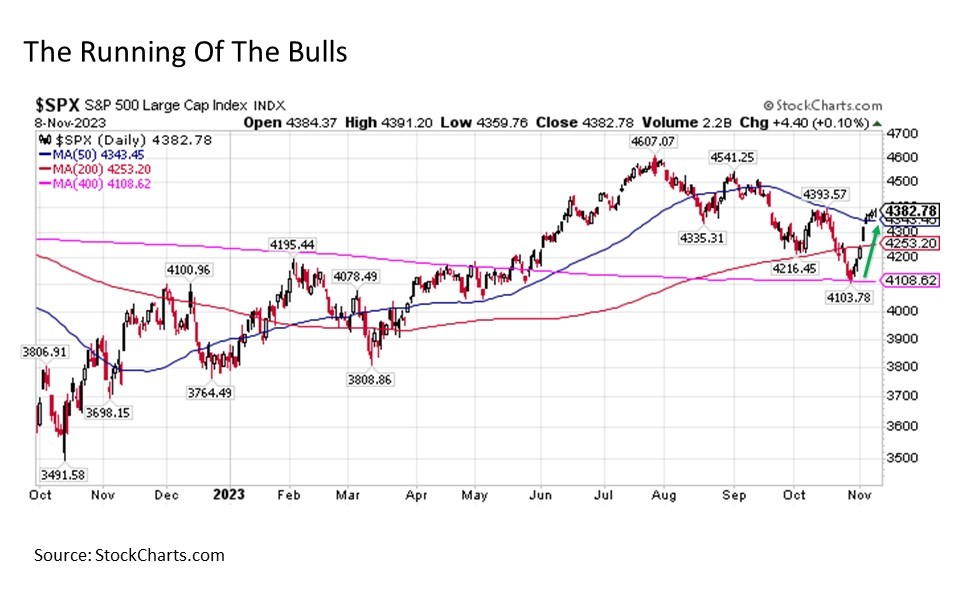
But no sooner did the new trading week begin on October 30, and U.S. stocks were exploding off of support to the upside. By the end of last week, the S&P 500 had not only decisively reclaimed its 200-day moving average support, but it also edged back above its 50-day moving average resistance for the first time since early August. And while the magnitude of gains have slowed into the current trading week, the S&P 500 continued to push to the upside having notched gains for eight straight trading days in a row through Wednesday, its longest winning streak since 2021.
With such a big move to the upside over such a short period of time in stocks, what can we reasonably expect from here?
First, underlying fundamentals support the stock rally. The U.S. economy remains strong, the labor market tight, corporate earnings have been revised higher so far this reporting season, profit margins continue to widen, inflation continues to subside, and stocks outside of the Magnificent Seven stocks of Apple, Microsoft, Amazon, NVIDIA, Alphabet, Meta Platforms, and Tesla are now trading at their most attractive valuations in years if not decades. In short, any further rally in stocks is well grounded.
Second, we are on the brink of entering the most seasonably favorable time of year for U.S. stocks from mid-November through mid-January. Stocks have historically performed well this time of the year (2018 being a notable recent exception) regardless of how they travelled through the fall, but they tend to generate particularly favorable seasonal returns during this period following a weak stretch from early August to mid-November. Given that stocks posted three consecutive monthly declines in August, September, and October this year for the first time this millennium, the table has been set for a potentially meaningful bounce with follow through.
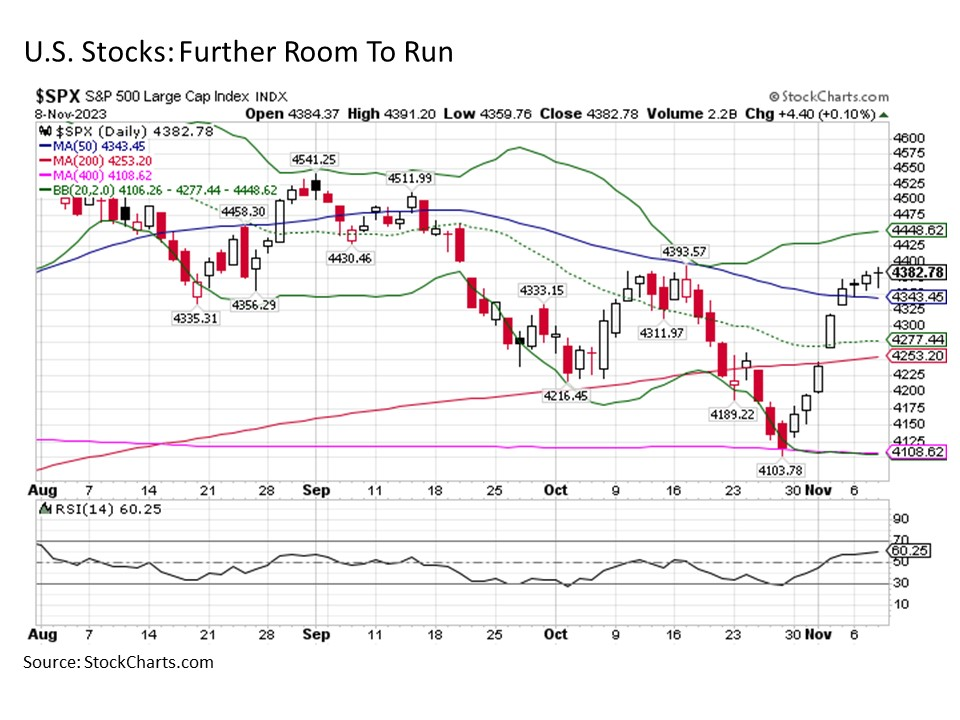
Third, while the upside move in stocks has been swift since the start of last week, technicals suggest the market has further room to run. Not only are stocks nowhere close to being overbought with an RSI at just over 60 (a reading of 70 or higher indicates overbought conditions, and thus a market that has risen too far, too fast and is due for a pullback), but the S&P 500 is also trading well within its Bollinger Band range (solid green lines in the chart above) with space as high as 4450 at present before entering statistical outlier territory.
Correbous. Another key potential upside driver for stocks comes from its asset allocation foil in the bond market. Just as stocks have struggled in recent months, so too have bonds. In fact, long-term bonds performed nearly twice as badly as the S&P 500 since the end of July through late October. And this poor bond performance provided a notable headwind for stocks. Why? Because as bond prices went lower, yields went higher, which caused the equity risk premium for stocks to remain small to negative despite the fact that stock prices were falling.
Thus, the recent swift rally in the bond market has provided an added jolt to the stock market rally. And looking ahead, it appears that the bond rally may only be getting started.
Bonds were long overdue to rally even more so than stocks. This has been particularly true for Treasuries in recent months given the fact that inflation is the primary determinant of U.S. government bond returns and both the headline and core inflation rates continue to steadily fall from their 2022 highs. Thus, the fact that the 10-Year U.S. Treasury yield was pushing as high as 5% as recently as two weeks ago had the benchmark yield running waaaaaay above its medium-term, long-term, and ultra long-term moving averages. For those “regression to the mean” fans out there, the bond market rally slingshot was pulled way back.
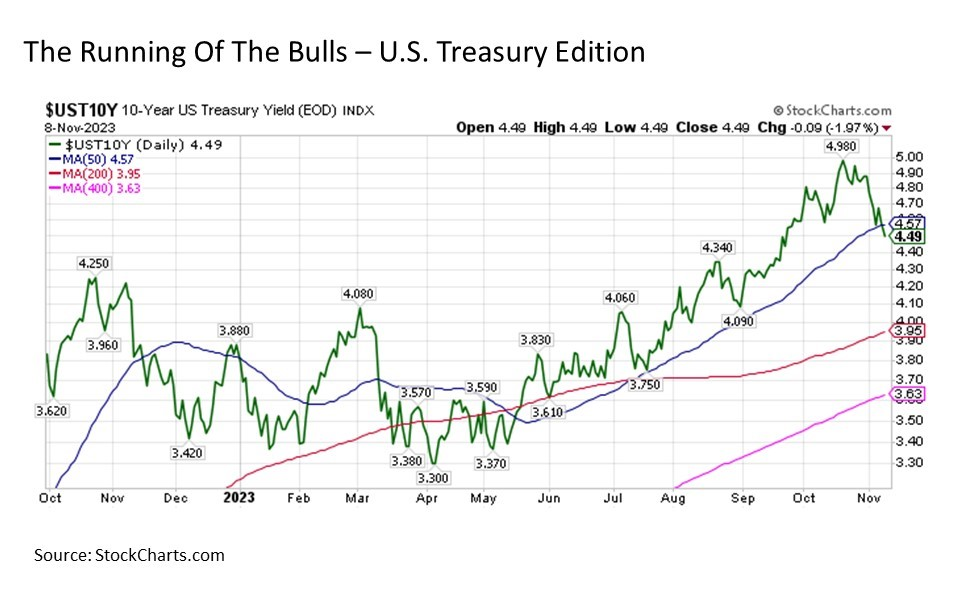
The bond market rally has been swift to date, and a key threshold was crossed in the rally during the trading day on Wednesday. A key resistance level for the 10-Year U.S. Treasury yield has been the 50-day moving average (remember in the chart above, higher bond yields mean lower bond prices). Since mid-May, the benchmark Treasury yield has traded above this key resistance level and failed both in mid-July and late August in breakout attempts. Today, the key yield level to watch has been in the 4.57% range. And following a soft bounce after first hitting this resistance level last Friday, the 10-Year sliced definitively through its 50-day moving average resistance on Wednesday for the first time in half a year.
The key question is whether bonds can sustain this breakout and continue the rally. For answers, investors must look no further than the 5-Year U.S. Treasury, which foreshadowed the resistance break in the headline benchmark Treasury when it made its own breakout last Friday and has held its ground since. In fact, what was once resistance has already become support for the 5-Year in the trading days since.
All of this bodes well for further declines in U.S. Treasury yields in the days and weeks ahead. In fact, one should not be surprised if we see the 10-Year stampeding its way back toward 4% or below before the end of the year. Not only would this provide a welcome boost to long suffering bond investors, but it would give a meaningful added tailwind to support additional moves higher in stocks too.
Bous al carrer. If the rally in stocks is indeed fully underway, how much higher can we reasonably expect the S&P 500 to go?
Given that the upward sloping trading channel for stocks dating back to October 2022 remains intact and recognizing that stocks historically do not go up in a straight line but instead oscillate, sometimes widely, within a larger market trend, this provides the framework to establish some key target levels for the S&P 500 in the coming months.
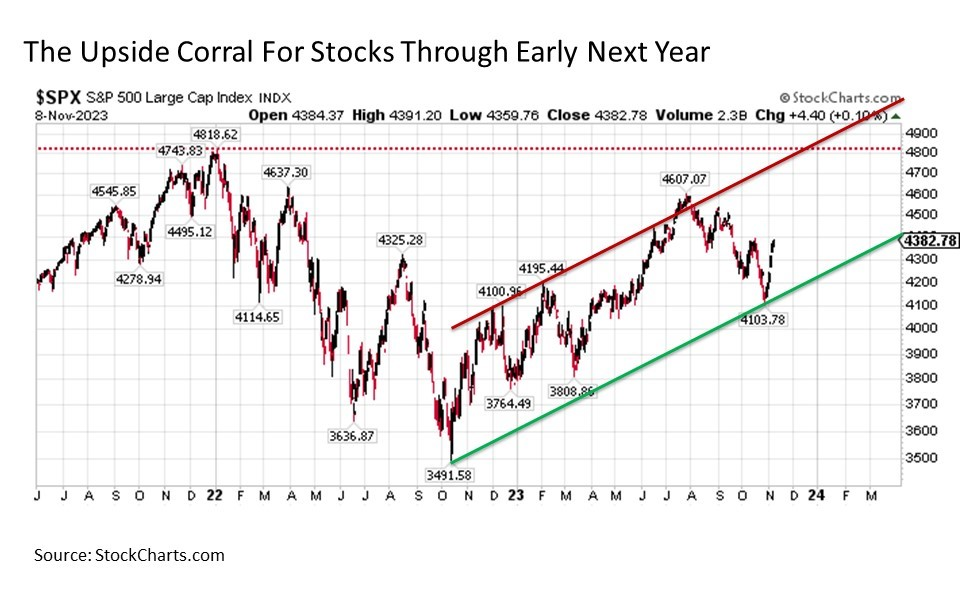
For the remainder of 2023, while the S&P 500 could be as low as 4250 by late December under this trading channel framework, it is far more reasonable to expect U.S. stocks to be hovering around the 4600 range by the end of the year. This would be another +5% upside from current levels. And while stocks would be trading at the very high end of their range to pull it off, it’s not beyond the realm of possibility that the S&P 500 could be striking a new all-time high above 4818 eclipsing its January 4, 2022 peak by the time 2023 draws to a close.
Moving into the first quarter of 2024, stocks would reasonably be trading in the 4300 to 5100 range if the current S&P 500 uptrend remains intact. And while north of 5000 in Q1 starts to get a bit pricey on U.S. stocks, this range is not entirely unreasonable given supportive underlying fundamentals.
Bottom line. The bulls are now running in both the stock and bond market as we enter the most seasonally favorable time of the year. While further bouts of downside volatility certainly cannot be ruled out, the risk-reward for both stocks and bonds is tilted meaningfully to the upside through the remainder of 2023.
Disclosure: I/we have no stock, option or similar derivative position in any of the companies mentioned, and no plans to initiate any such positions within the next 72 hours. I wrote this article myself, and it expresses my own opinions. I am not receiving compensation for it. I have no business relationship with any company whose stock is mentioned in this article. Investment advice offered through Great Valley Advisor Group (GVA), a Registered Investment Advisor. I am solely an investment advisor representative of Great Valley Advisor Group, and not affiliated with LPL Financial. Any opinions or views expressed by me are not those of LPL Financial. This is not intended to be used as tax or legal advice. All performance referenced is historical and is no guarantee of future results. All indices are unmanaged and may not be invested into directly. Please consult a tax or legal professional for specific information and advice.
Compliance Tracking #: 503306-1
